NDepend has been around for quite a long time. If you are unaware of what it does, you should be checking it. It's an analysis tools which helps you find inconsistencies and discrepancies in your C# source code. I've been trying it out recently and helped me found certain issue which I wasn't aware of.
To be clear, there is indeed other available solution and it's up to your team to decide which fits best with you. In this case, NDepend runs independently from any IDE, but you can install an integration plugin inside Visual Studio. This can give the leverage/advantage to avoid loading any IDE to obtain a report. Unfortunately, there is no plugin/extension support under JetBrains Rider, my personal IDE of choice, like there is under Visual Studio. I hope their team can implement one, that would be greatly valuable.
Dashboard
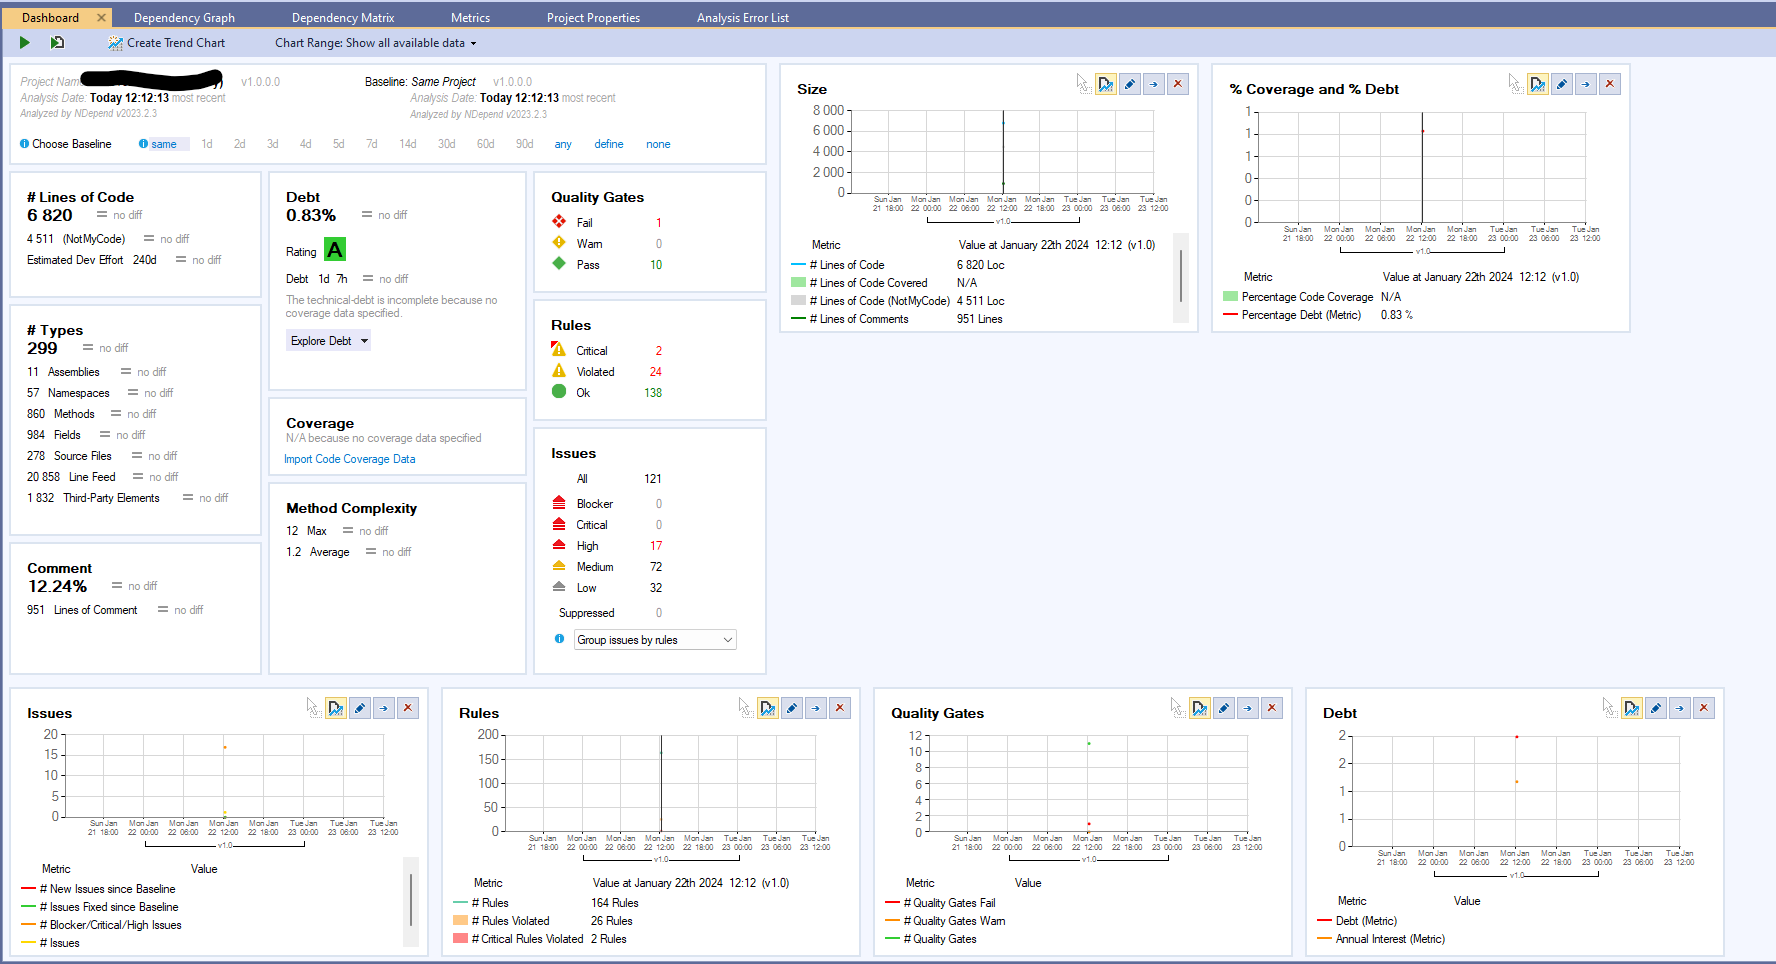
Once a solution analysis is completed, you will be greeted with the dashboard tab:
Here lies a general overview of the quality of the whole solution that you have analyzed. This gives a great quick shot of the elements you could get your hand onto if your goal is to refactor the code to make it more maintainable. You can personalize the rules and change them to your likings. For example, in my previous screenshot, there is one critical rule that flags I'm using a type within another type which have both different namespaces. The debt explanation is interesting. Of course, you can always decide to ignore it, but it gives an interesting point of view regarding the fact that some developers are using folders within a project to "organize" classes, which can lead to this kind of rule alert. Of course, everything is to take with a grain of salt, as I agree with someone from the comments of this Stack Overflow thread, these kind of alerts can be opinion based. An interesting thing that NDepend's team could be adding inside their analysis program is rule categorization; Opiniated ones versus the others by example. It could help to quickly address undiscussable items and leave any development team to discuss the other opiniated points and see whether they need to be addressed.
Dependency Graph
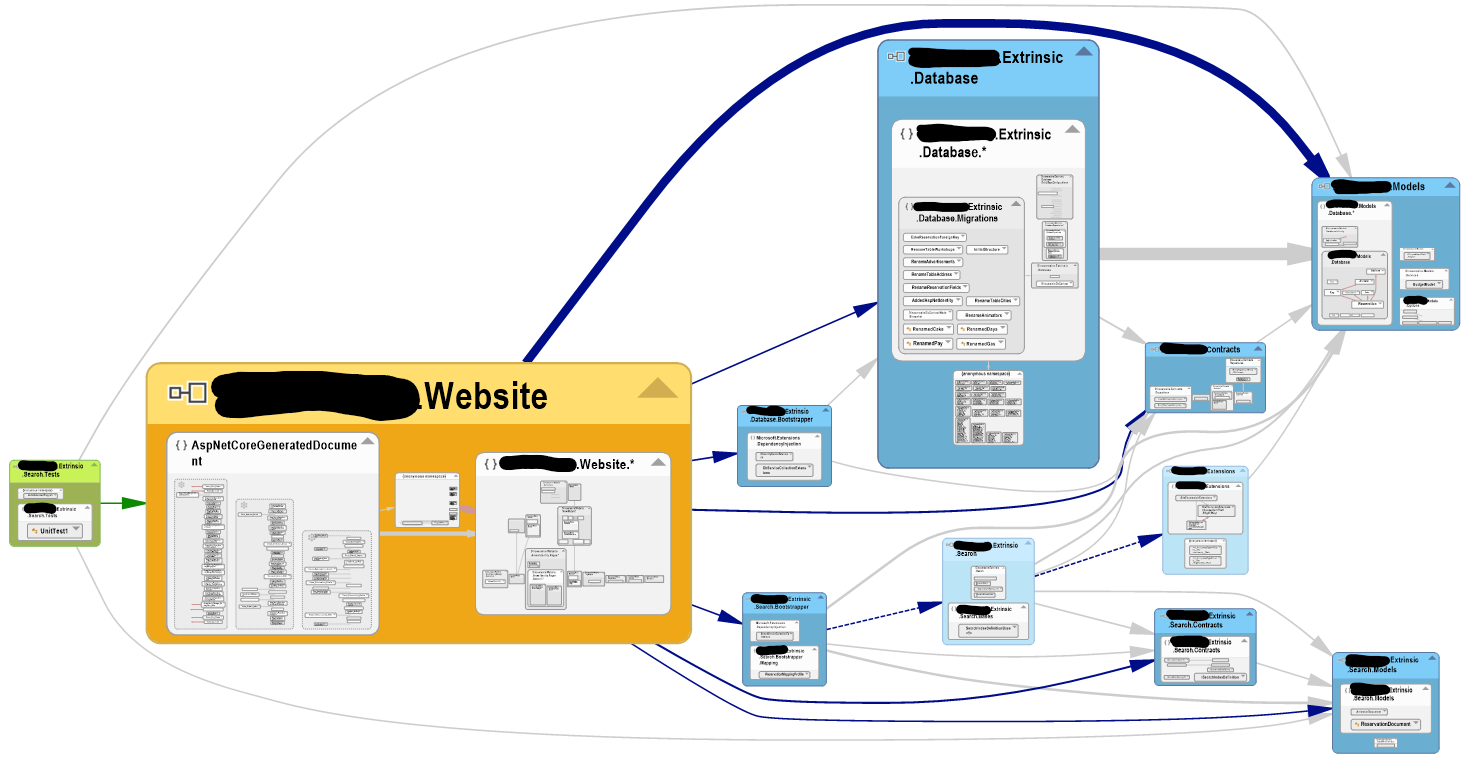
I think the most interesting feature of NDepend is the dependency graph. It's so incredibly useful to quickly identify areas of your code that aren't supposed to inherit another project within your solution. This can otherwise, to my opinion, often lead to solutions having classes/elements heavily coupled/entangled together. Based on the same project that I have used to create my first screenshot, here is an example of the graph:
As you can realize in the previous screenshot, there is a design pattern here that I often follow in projects:
- The website is the main "referrer" of projects, meaning that nothing should be referencing the website.
- The exception are the unit tests. You can also realize the only additional reference of the test projects are the "Models" projects. Nothing else.
- The "Bootstrappers" projects serve only the purpose to add inside the IoC container the necessary services that are consumable by all "Contracts" projects.
- Each consumable "Contracts" projects comes in pair with a minimum of an additional "concrete" implementation project. These projects, as previously mentioned, only contain the implementation your contracts, which will then be consumed by the website.
- Almost everything consumes the "Models". This is again, by design. Models are the basically "the end of the road", it should generally refer nothing else.
I will be doing another blog post about the design pattern I personally follow in projects.
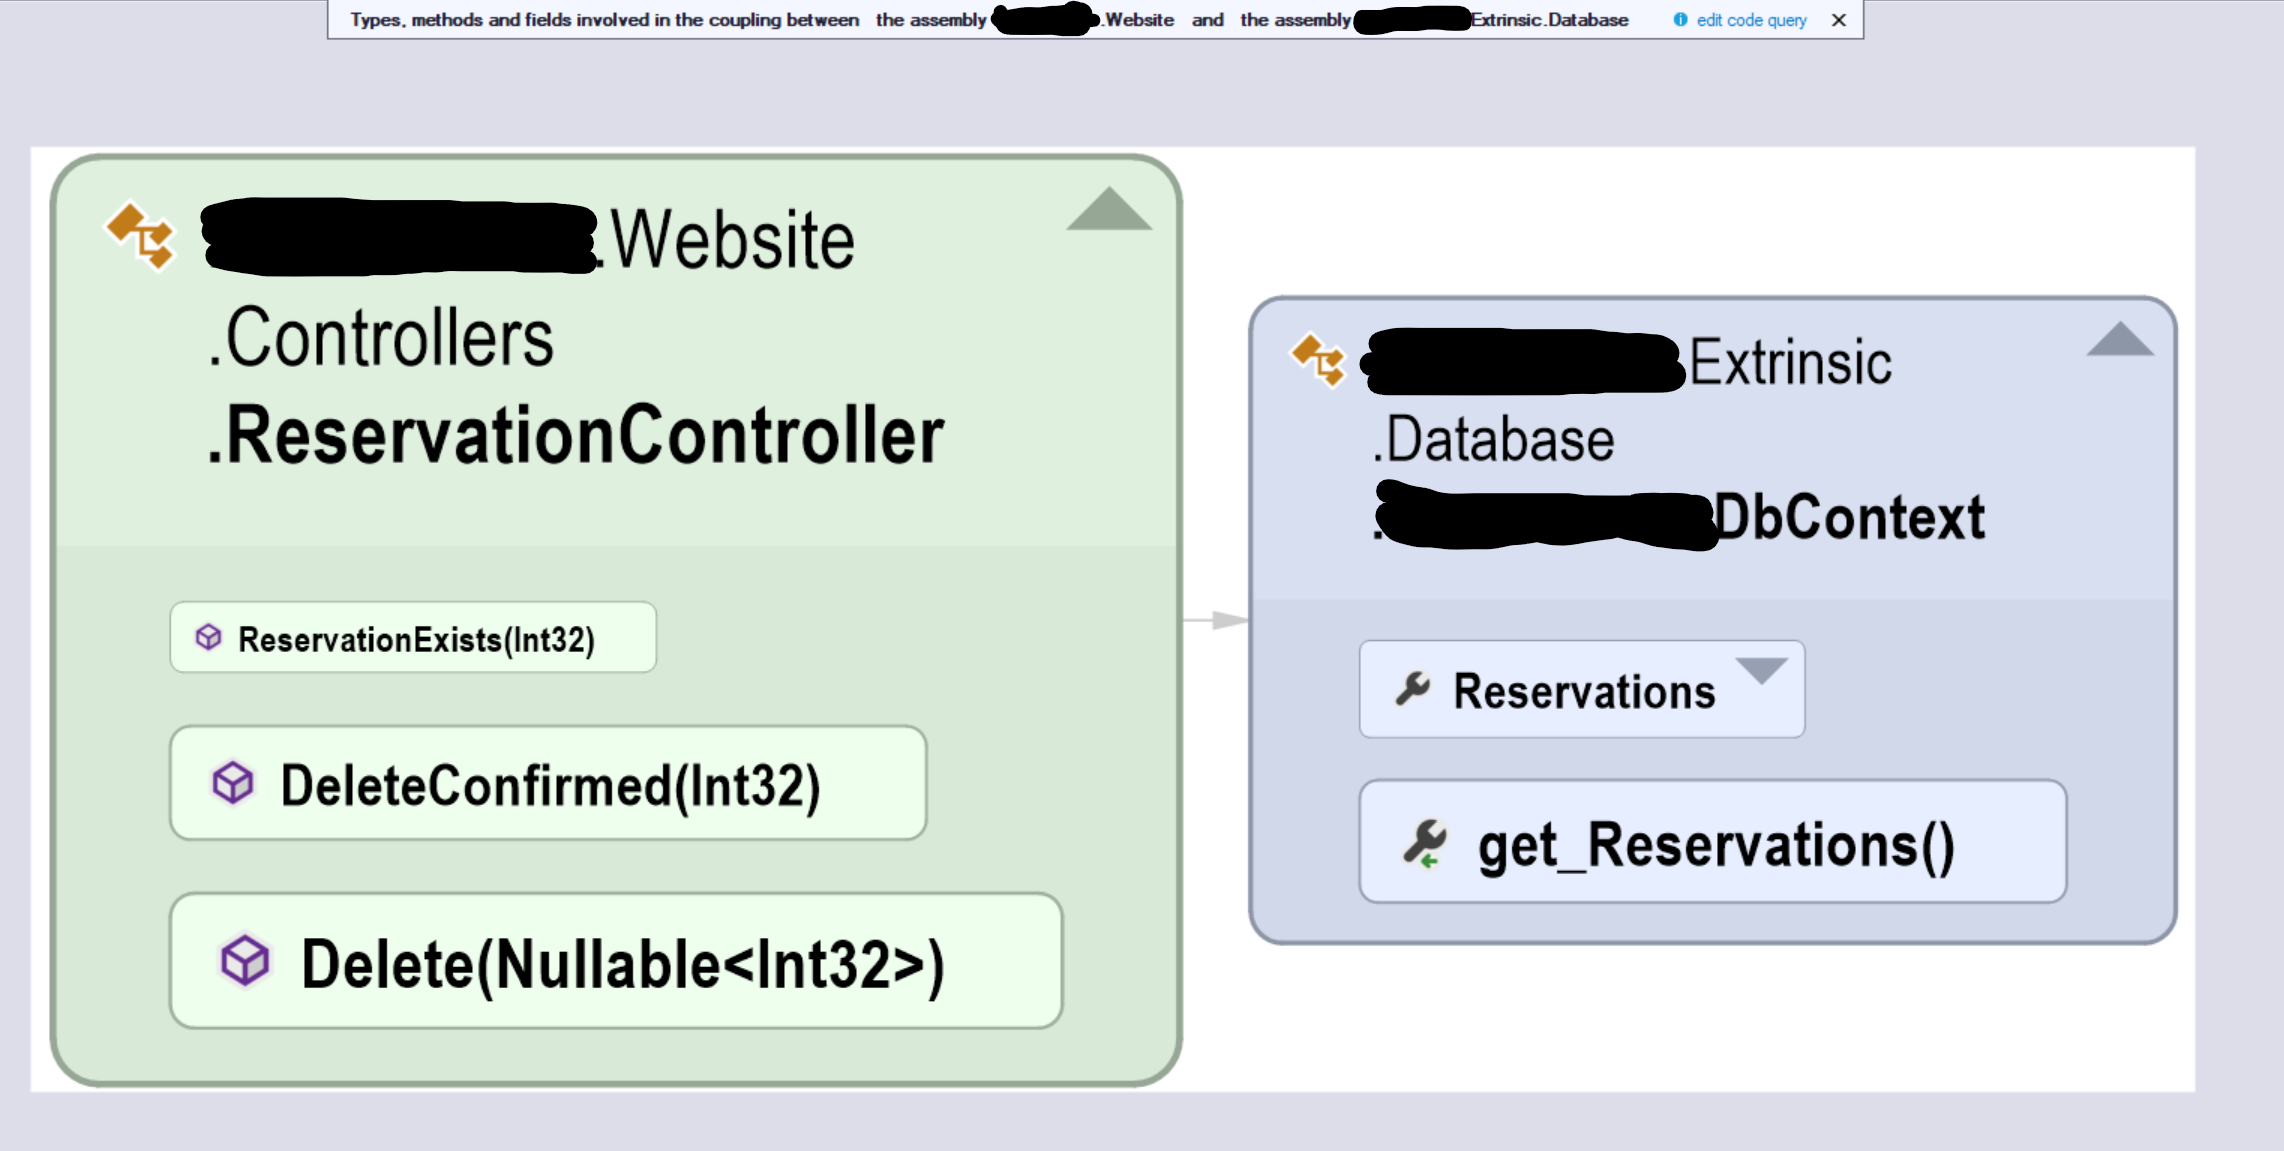
NDepend quickly identified a discrepancy in my project: There is a direct reference from the website to the database library and this is not normal. Double clicking on the arrow gives me the following:
With that, I can easily remove the three direct references from my code and refactor to use my repository pattern implementation. It's one of many example that can clearly help you and your team to identify elements such as this one.
Metrics
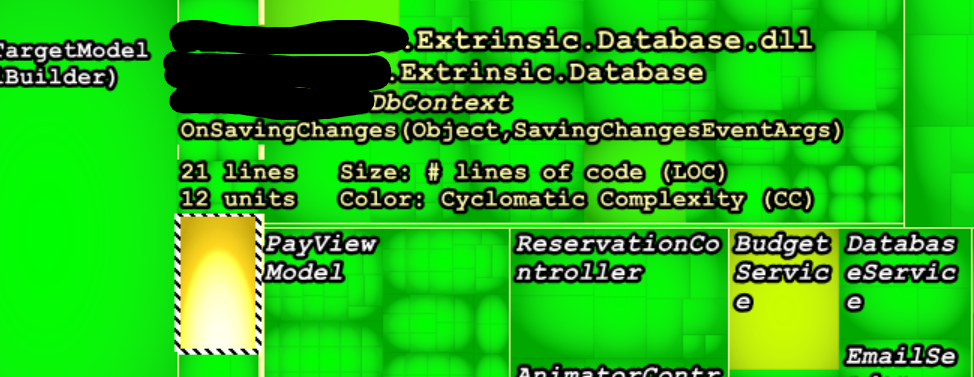
The "Metrics" tab is again another great example of the tool usefulness; From there you can view "heated" areas of your code which has strong cyclomatic complexity. Here in my example, the following method is considered a bit more complex:
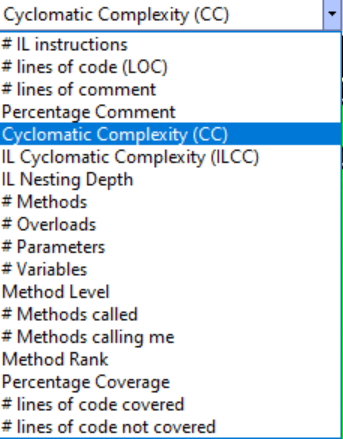
Double clicking it opens the file in your preferred IDE and points your cursor directly to the method. If you're interesting to have different insights, you can also change the metric data type to something else:
Closure
There is also a CI/CD integration that you can install. Obviously, the goal is to obtain those analysis directly from your build pipelines so that you can act preventively on any code quality depreciation. If you're interested, you can also view certain sample reports at the following URL: https://www.ndepend.com/sample-reports/. For Optimizely solutions, CD/CI can come super handy because such projects can quickly become a burden maintainability wise.
